BDSwiss App
Download & start trading


Rates as of 05:00 GMT
Market Recap
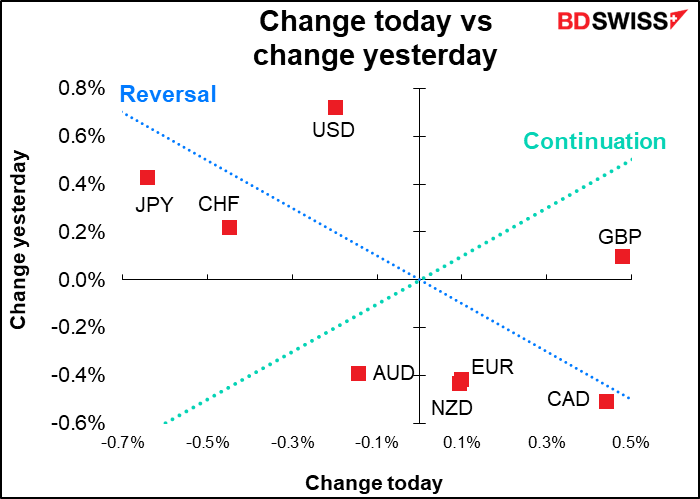
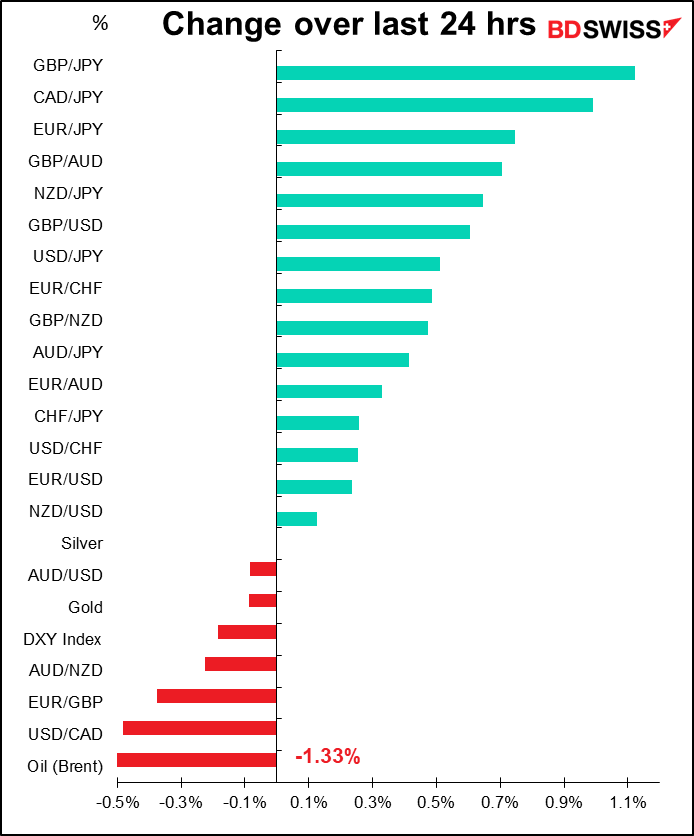
Tuesday’s market action was in part just a reversal of Monday’s. The safe-haven currencies that gained on Monday (USD, JPY, CHF) were the main losers. The commodity currencies weren’t the main gainers, though.
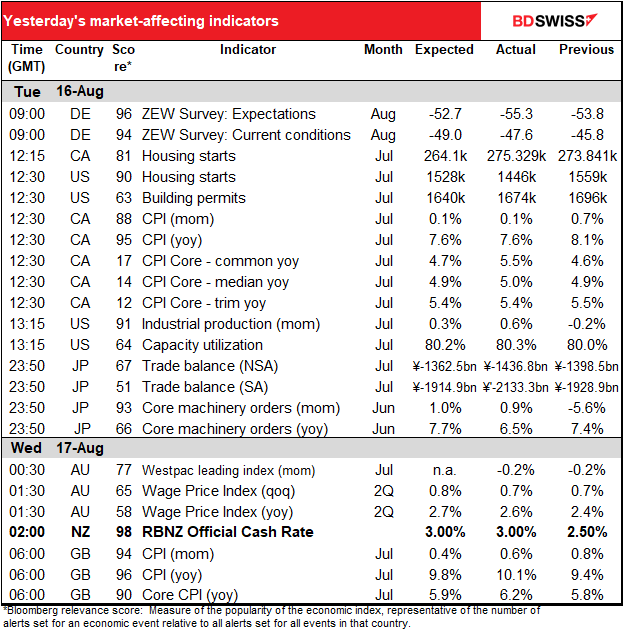
GBP was the best-performing currency after yesterday’s UK employment data showed payrolls increasing by double the estimated number and average earnings rising much more than expected (see table above). The solid results confirm the Bank of England’s worries that “Domestic inflationary pressures are projected to remain strong over the first half of the forecast period” because of the “tight” labor market and high “underlying nominal wage growth.” This morning’s higher-than-expected UK consumer price index (CPI) (see table able) should only reinforce that view. The Bank of England forecast inflation of around 13% by Q4, but it looks like the country could get there even earlier.
Fitting in with the reversal theme, Monday there was a global move lower in bond yields. Tuesday they all moved back up, with GBP taking the lead.


The initial impetus for the move higher in rates came from Canada, where two of the three core inflation measures came in higher than expected. Not only did this have an impact on Canadian bond yields but also pushed up US Treasury yields. It’s significant that the market paid more attention to the rise in core inflation than to the fall in headline inflation, which admittedly had been expected. This ties in with what I said in my Weekly Outlook: that as the price of globally traded energy and foodstuffs falls, capping headline inflation, countries will see more divergence in their core inflation measures and that core inflation measures are likely to guide central banks rather than headline inflation.

US Treasuries were then pushed further by a higher-than-expected US industrial production figure, which alleviated some of the concern caused by yesterday’s collapse in the Empire State manufacturing survey.
It’s worth noting the sharp rise in European bond yields, which went along with an increase in expected European inflation (second only to Britain, thanks to the jump in actual inflation there).

The move in European inflation expectations and bond yields was probably driven by the continued rise in natural gas prices there, plus expectations for sharply higher electricity prices in the future. German electricity in one month is up 6.2% from Monday and electricity for a year from now up 7.2%.

About half the move in currencies was attributable to the change in two-year yields, which encompass expectations for monetary policy. Ten-yield yields (not shown) had less impact.
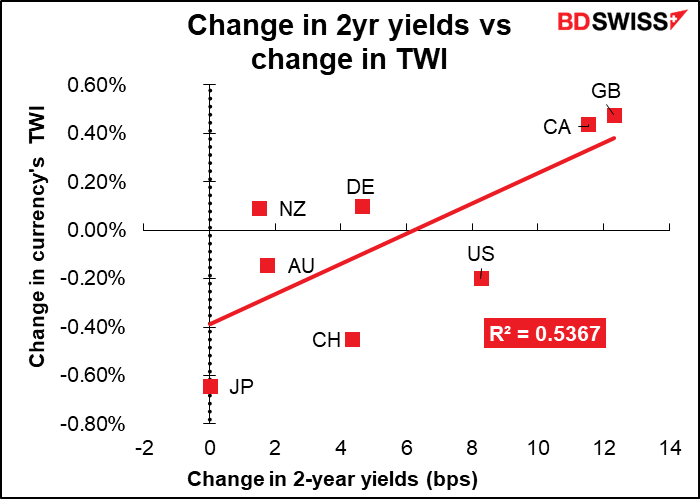
The lack of any movement in New Zealand yields was quite noticeable as it came after the Reserve Bank of New Zealand (RBNZ) meeting. The RBNZ hiked rates by 50 bps, as was widely expected. They also left in the phrase “at pace” (“The Committee agreed it remains appropriate to continue to tighten monetary conditions at pace to maintain price stability…), signaling that another 50 bps hike at the September meeting is likely.
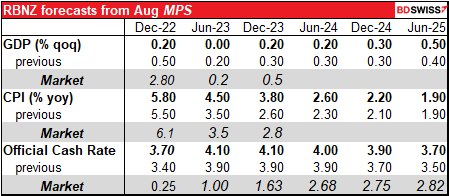
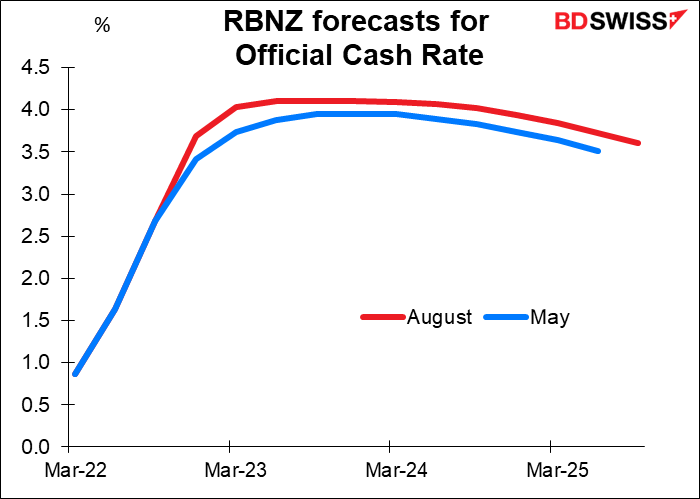
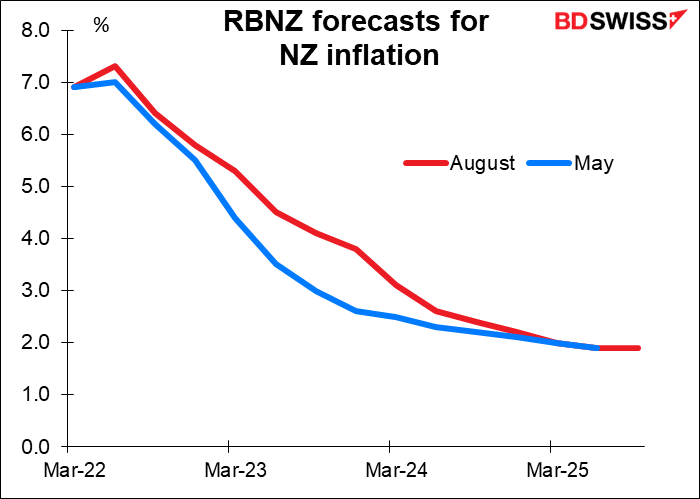
The RBNZ revised its growth forecasts down and its inflation forecasts up, but raised its forecast for the official cash rate (OCR) only slightly. It now expects the OCR to peak a bit earlier (Q2 2023 instead of Q3) and to begin coming down a bit earlier too (Q1 2024 vs Q2). With little change in the forecast for rates, there’s little need for the currency to adjust.
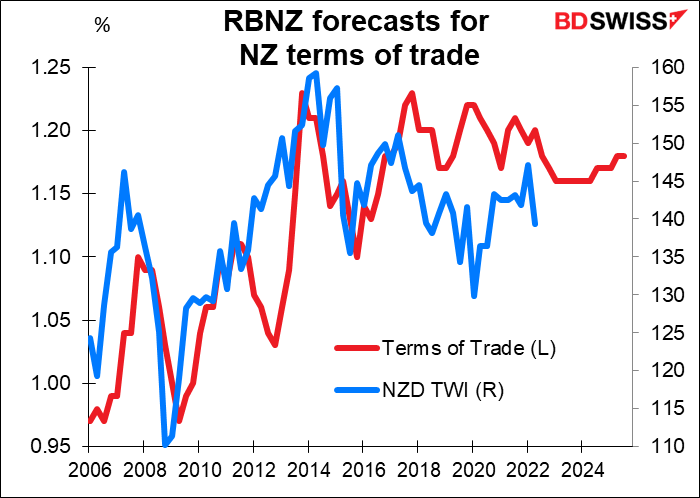
The RBNZ’s Monetary Policy Statement also includes a forecast for New Zealand’s terms of trade (the change in the unit value of exports relative to imports). The terms of trade often exert a strong influence on the currency in an export-led economy such as New Zealand. The RBNZ’s forecast would imply little change in the New Zealand trade-weighted index over the next two years.
Today’s market
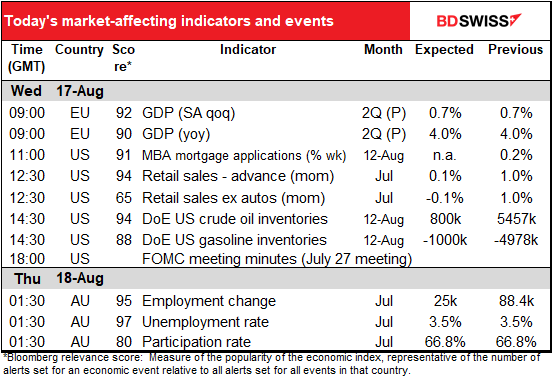
Note: The table above is updated before publication with the latest consensus forecasts. However, the text & charts are prepared ahead of time. Therefore there can be discrepancies between the forecasts given in the table above and in the text & charts.
The day starts out with the provisional EU-wide GDP for Q2. Don’t be fooled by the name, that’s the second version – the first is the advance GDP. The figure is rarely revised more than ±10 bps so I won’t tarry over it.
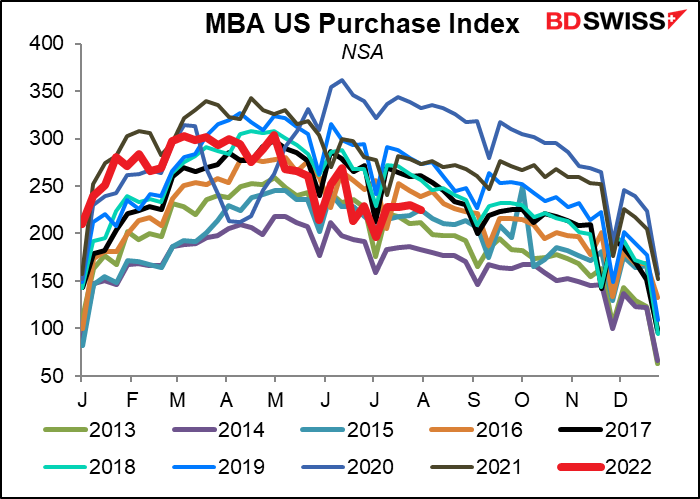
US mortgage applications started the year strong but are now only middle-of-the-road – about average. Still, considering that mortgage rates are up over 200 bps so far this year.
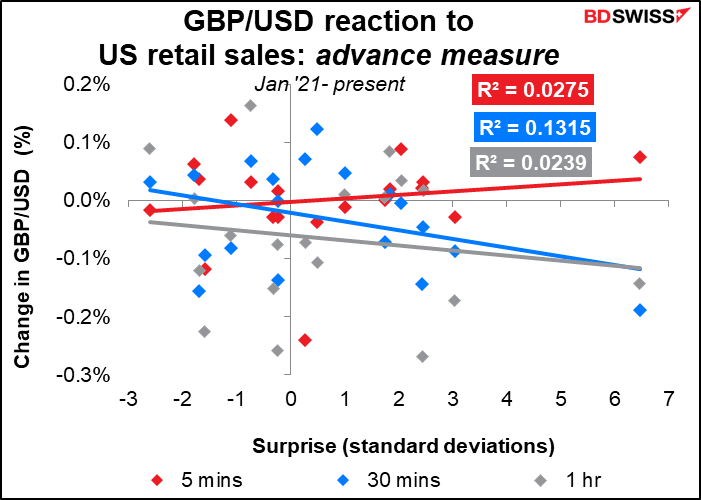
US retail sales is the major US indicator out this week. That’s because some 70% of the US economy is private consumption, of which retail sales comprises some 40%. That means retail sales account for approximately 28% of the US economy. There are four different versions of this indicator, each one more narrowly focused.
The “advance,” or headline figure, which includes the most categories, is the most closely correlated with subsequent movements in the exchange rate and so that’s the one I focus on. It’s expected to be pretty weak: only a small increase of +0.1% mom, and that’s with a rebound in auto sales during the month. On the other hand this reading would be depressed by the fall in gasoline prices, which averaged $4.93 a gallon in June and $4.53 in July.
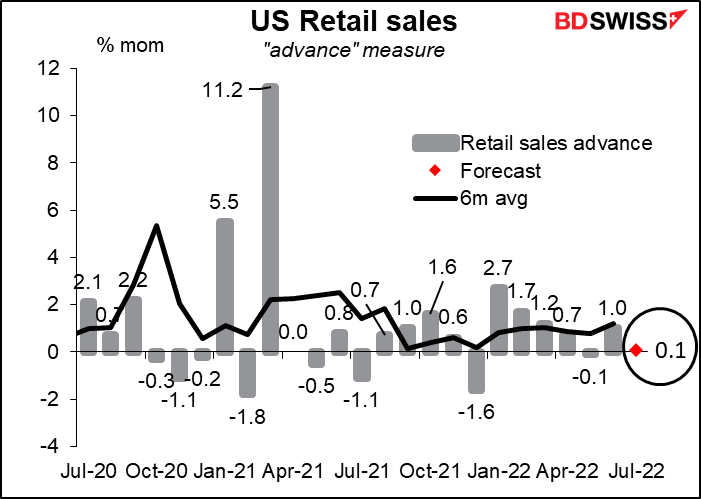
The figure excluding autos and gasoline is expected to show no increase at all (same for the version excluding only auto sales, not shown)..

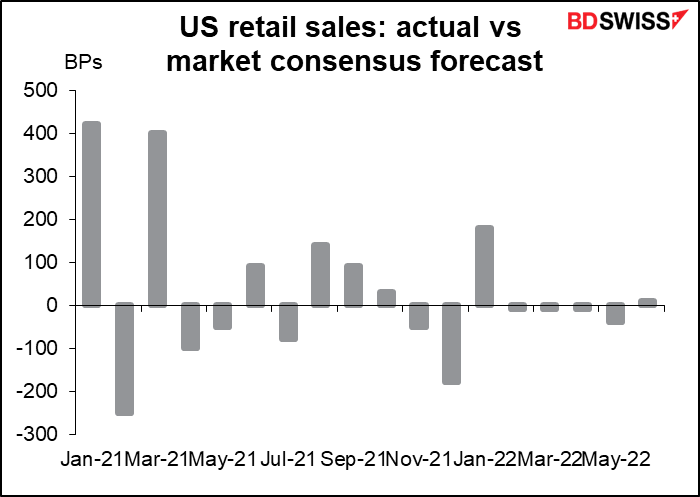
How well do economists do forecasting this indicator? Pretty well. Since Jan. 2021 the indicator has beat estimates 8 times and missed 10 times. However the misses have been relatively small recently. There was a -180 bps miss in December 2021 and a +180 bps beat in January 2022, but since then there were four misses of ±10 bps and one miss of 40 bps – not bad.
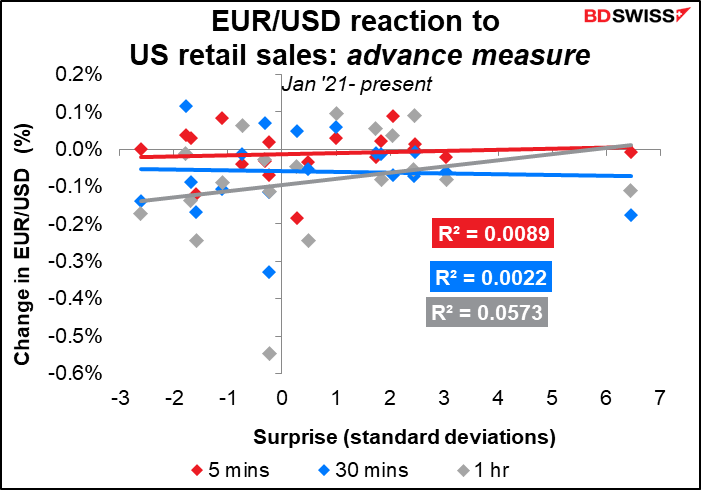
While this is a key indicator for the US economy, it doesn’t seem to have that strong or consistent an impact on the foreign exchange market. Currencies seem singularly unimpressed.

Then we get to the minutes of the July 27th meeting of the Federal Open Market Committee (FOMC), the body that sets interest rates for the US central bank. Although they hiked rates by 75 bps at the meeting, the market latched onto some dovish points in Fed Chair Powell’s press conference, namely that the Fed would downshift from 75 bps “at some point” and that they would make that decision based on growth, the labor market, and how close there are to the “neutral” rate fo fed funds, of course with the inflation rate itsefl remaining the main driver of policy.
Since the meeting though officials have pushed back on this interpretation. They argue that policy isn’t yet at neutral, that they have a lot further to go in fighting inflation, and that the market is incorrect in assuming the Fed will cut rates early next year.
Nonetheless, more recent comments have indicated some divergence among Committee members on the path ahead. Members seem undecided themselves about whether a 50 bps or 75 bps hike would be appropriate next month, mirroring the indecision in the market. The main point people will be looking to the minutes to see is how they will make this decision. How will they decide that a downshift to 50 bps is warranted? The signals from the minutes (and from officials’ comments) will become even more important as the Fed shifts from relying heavily on forward guidance to a more data-driven, meeting-by-meeting decision mode.
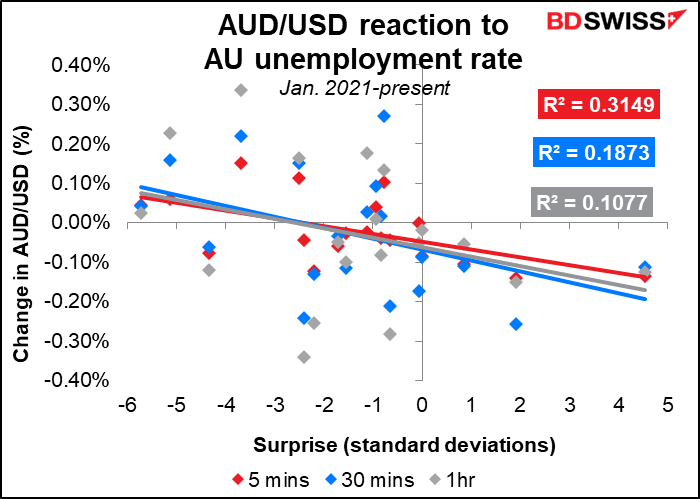
Overnight, Australia announces its employment data. The Reserve Bank of Australia is one of the central banks that has a dual mandate, i.e. it has to worry about employment as well as inflation. Thus employment is a key indicator for Australia much the same way it is for the US. Another similarity with the US is that the labor market in Australia is tremendously tight, maybe even tighter than in the US. The unemployment rate is at a record low (data back to 1978) and employment now far exceeds the pre-pandemic level, which is even better than the US. Accordingly it’s not restricting monetary policy at all. On the contrary, they said at their last meeting that “The Bank’s business liaison program and business surveys continue to point to a lift in wages growth from the low rates of recent years as firms compete for staff in the tight labour market.” Signs of continued strength in the labor market, like what the market is expecting, could force the RBA to tighten more aggressively. This could be positive for AUD.

Anyone thinking of trading this indicator should watch the unemployment rate and trade it via AUD/NZD, not AUD/USD, which doesn’t reflect the surprise as consistently.

 Marshall Gittler
Posted on 23 April, 2024 at 11:46 GMT
Posted on 22 April, 2024 at 14:46 GMT
Posted on 19 April, 2024 at 13:15 GMT
Posted on 18 April, 2024 at 13:00 GMT
Posted on 17 April, 2024 at 15:37 GMT