BDSwiss App
Download & start trading

Rates as of 05:00 GMT
Market Recap
What a shocker! The year-on-year rate of growth in the US consumer price index (CPI) was expected to slow from June’s 40-year high, but not as much as it did! Particularly shocking was the fact that the month-on-month change fell to zero – that is, prices were unchanged overall during the month. (In fact it was even better than that – the mom change was -0.02%.)
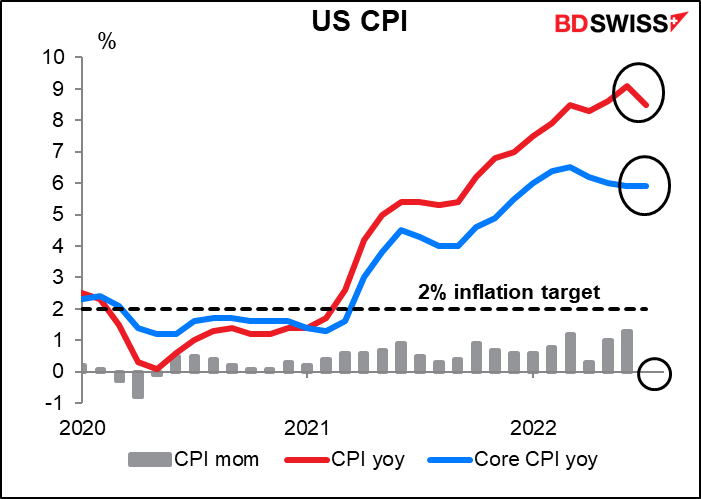
Prices didn’t really all stay the same, of course. What happened was that energy prices offset the rise in other prices – they fell 4.6% month-on-month (mom) in July after rising 7.5% mom in June, with gasoline prices in particular down 7.7% mom. That effect is likely to continue for some time as falling energy prices in general and gasoline prices in particular push down the headline inflation rate over the next few months. In contrast, food prices continued to rise because it takes longer for falling agricultural commodity prices to pass through to the consumer.
Excluding energy and food, core inflation also slowed significantly. It came in at less than half the mom pace of June, +0.3% mom vs +0.7% mom (+0.5% mom expected). Core goods prices rose 0.23% mom, down from 0.8% mom in June. New car prices rose but used car prices, the inflation villain for much of the post-pandemic period, fell after two months of strong increases. Core services on the other hand were up 0.35%, largely reflecting strong rents and owners’ equivalent rent offset somewhat by falls in travel-related components, such as airfares and hotels. Rent inflation declined slightly but that’s only after two consecutive 25-year highs in May and June.
Net net, after two months of higher-than-expected increases across all major categories in May and June, the July report provides some indication that indeed inflation may well have peaked. Given market expectations for lower oil prices, headline inflation should continue to decline, perhaps even surprisingly quickly. However that outlook might not extend to core inflation, where upward pressures remain uncomfortably high (such as the aforementioned rents) and are likely to be more persistent.
How is the Fed likely to interpret the data? Signs that inflation is peaking may help to prevent household inflation expectations from running away. That would certainly be helpful. But the Fed has often said that the trend in core inflation is more useful than headline inflation in predicting the trajectory of underlying inflationary pressures. Although core inflation did slow, it’s probably not enough to convince Fed officials that they can deviate from the steep tightening path that they’ve described for this year.
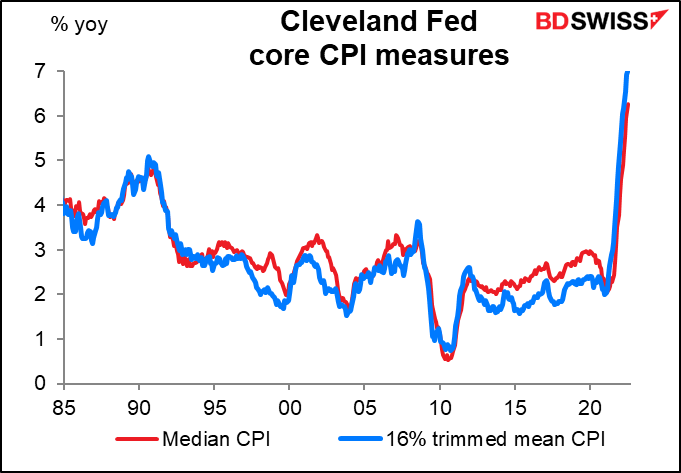
For example, the Cleveland Fed was quick to point out on Twitter that their trimmed versions of the CPI had continued to rise. “While the year-over-year reading of CPI inflation declined from 9.1% in June to 8.5% in July, median CPI and trimmed mean CPI came in at 6.3% and 7.0%, respectively, indicating inflationary pressures remain broad-based.”
Explanation:
Benefits: By omitting outliers (small and large price changes) and focusing on the interior of the distribution of price changes, the median CPI and the 16 percent trimmed-mean CPI can provide a better signal of the underlying inflation trend than either the all-items CPI or the CPI excluding food and energy (also known as core CPI).
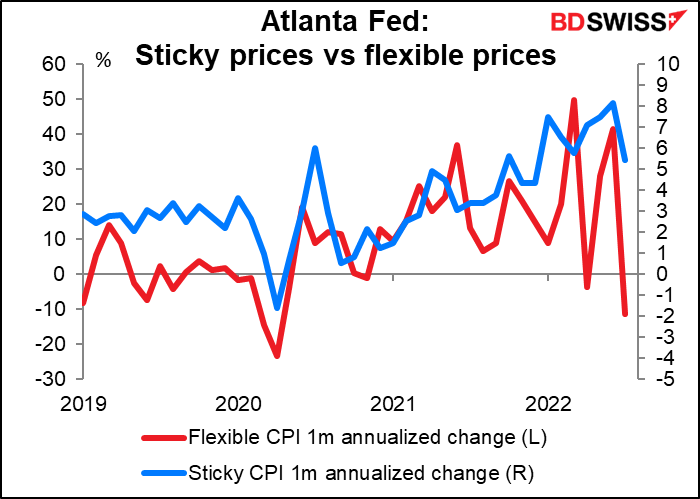
The Atlanta Fed’s “sticky price” CPI, which breaks the CPI down into “sticky” prices that change only slowly (such as printed prices on menus or public transportation prices) and “flexible” ones that change frequently (such as gasoline or air fares) showed that while flexible prices have started to come down, sticky prices continue to rise, just not as quickly as before. That’s a big worry for the Fed still, because people resetting these sticky prices will do so with their estimate of future inflation in mind. As long as people expect inflation to remain high, they’ll set these prices to compensate for future inflation. That makes it difficult for the Fed to get inflation back down to their 2% target.
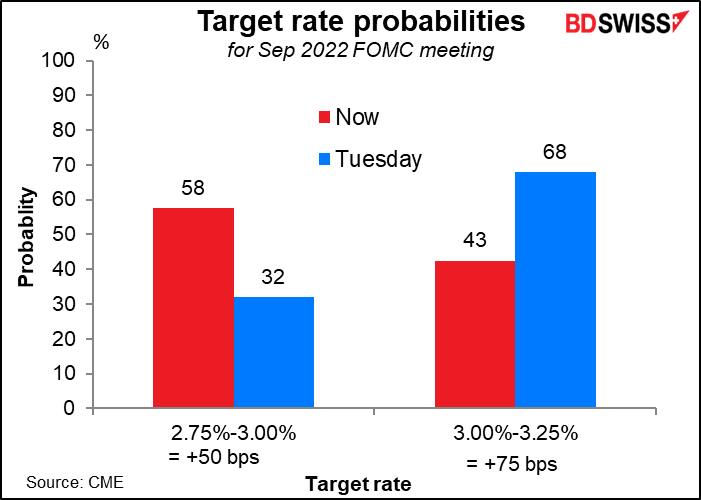
The news send the implied rate on fed funds down 5-8 bps. At the margin it has made a 50 bps hike in September slightly more likely than 75 bps, but pretty much a coin toss. Much depends on the August CPI print (which comes out on Sep. 13th, in time for the Sep. 21st FOMC meeting).
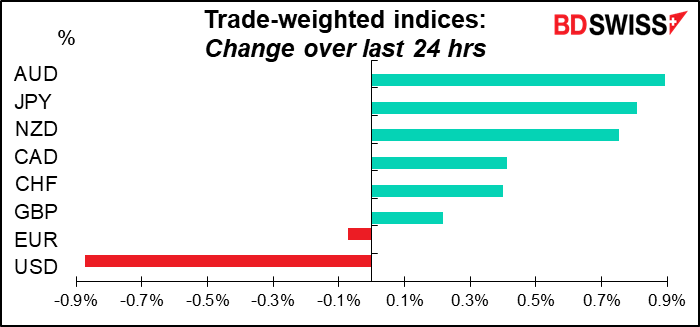
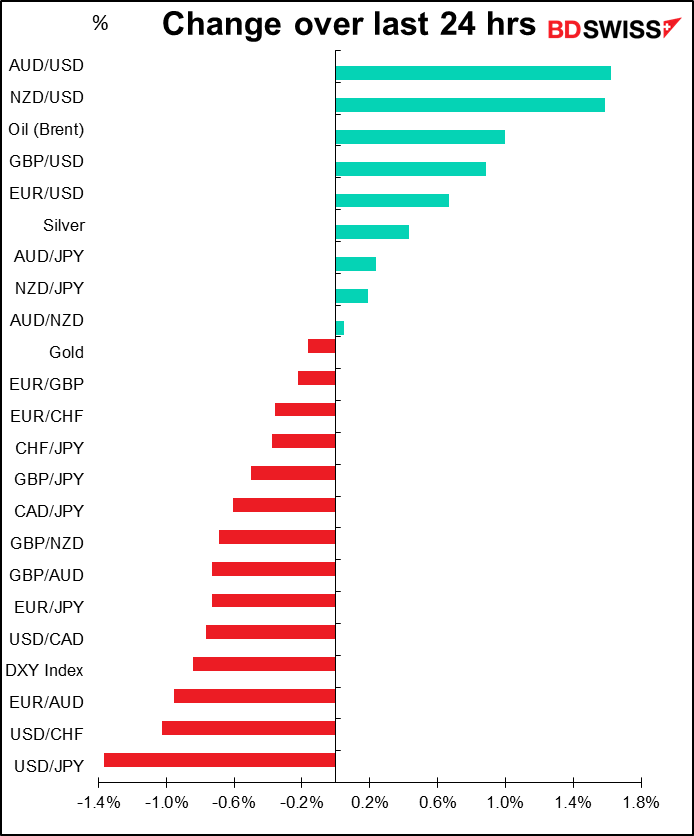
It’s no surprise then what the reaction in the FX market was: USD weakened and the risk-sensitive commodity currencies strengthened.
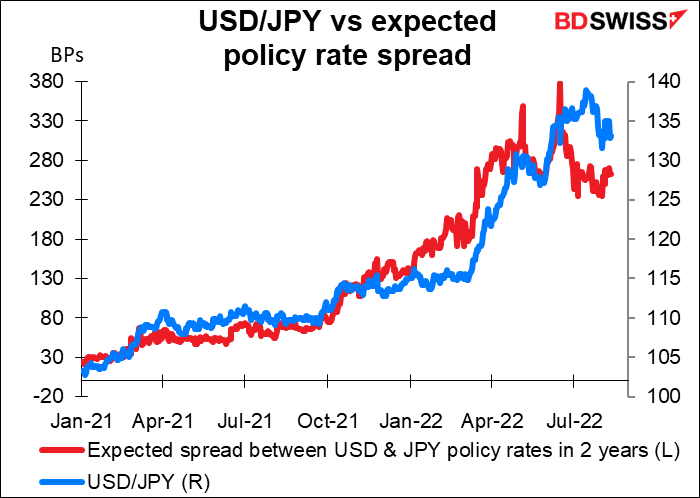
Also JPY, the main counterpart of the “monetary policy divergence” trade, rose too. That’s because the Bank of Japan is on hold indefinitely. If global inflation starts to slow, then other central banks may also cut back on their tightening plans, meaning that the expected interest rate gap between them and the US won’t narrow that much. But since Japan isn’t expected to raise rates at all, any change in US rate expectations has a one-to-one impact on the expected spread between US and Japan rates.
Today’s market
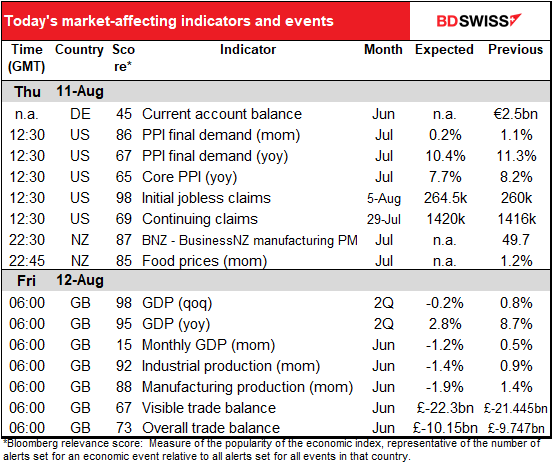
Note: The table above is updated before publication with the latest consensus forecasts. However, the text & charts are prepared ahead of time. Therefore there can be discrepancies between the forecasts given in the table above and in the text & charts.
If you’re following oil (or oil-related currencies, like CAD), there are two items coming out today that aren’t on the schedule that you might want to look out for: both OPEC and the International Energy Agency release their monthly analyses of the oil market today.
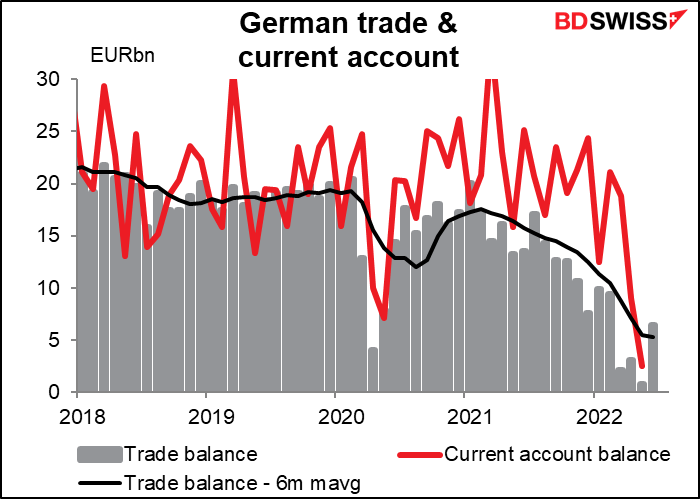
I’m not sure what time the German current account comes out. Normally I don’t pay much attention to this indicator because the market doesn’t, either. But with Germany’s trade and current account surplus disappearing, the EU’s as a whole will fall into deficit at the same time as its financial markets are lagging. People may start to pay more attention.
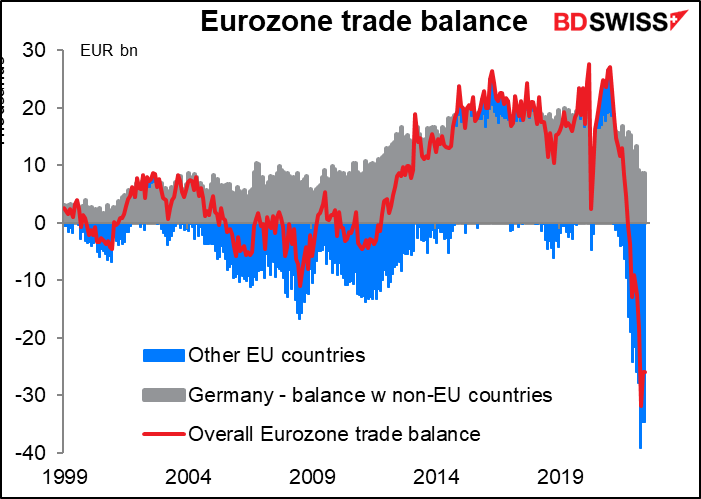
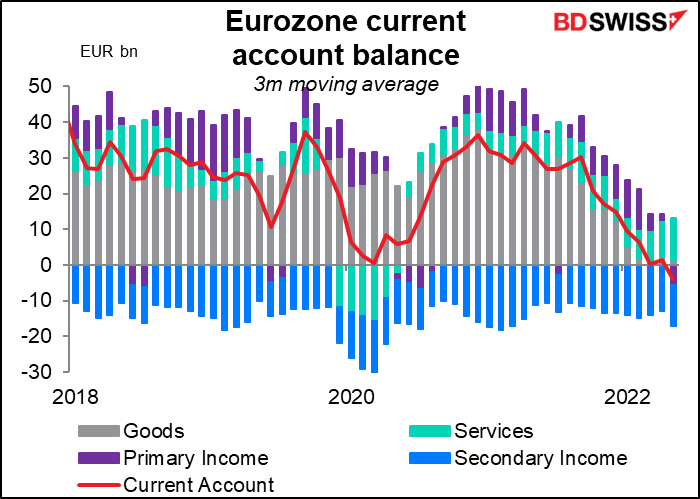
We don’t have the data to break out Germany’s current account surplus with non-Eurozone countries, but note how the Eurozone’s current account balance has switched into deficit as the surplus on trade in goods has evaporated. (This data is until May; it gets worse.) Higher energy prices are likely to keep that trend alive for some time.
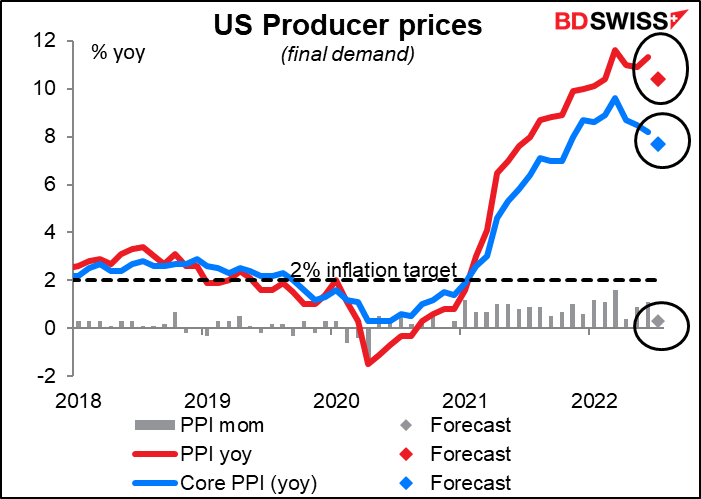
Next up is the US producer price index (PPI). Following yesterday’s lower-than-expected US CPI, the expected decline in the rate of growth in the PPI may help to cement the idea that inflation is slowing. This would therefore be negative for USD.
The three-month annualized rate of change is forecast to slow, too. This may spark thoughts that inflation is starting to ease off, which could be negative for USD.
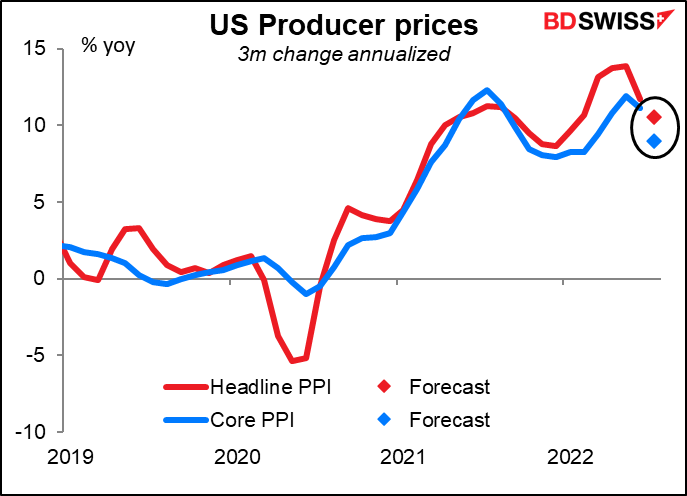
The relationship between the PPI and CPI is far from simple, though. I wrote a piece explaining this question – The PPI and the CPI: what’s the connection?
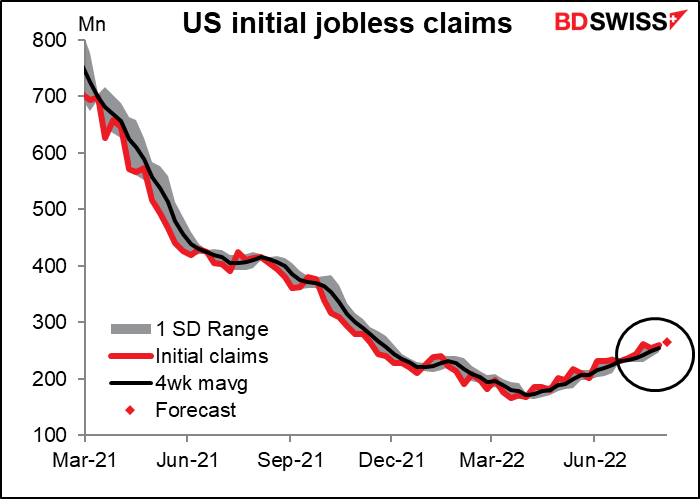
US initial jobless claims are expected to continue to creep higher. People were looking at this as a sign that the job market is worsening, but last Friday’s blowout US nonfarm payrolls put paid to that idea.
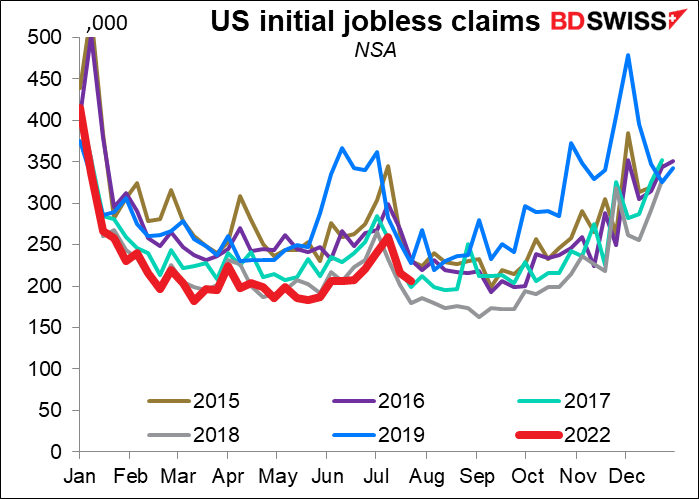
But as you can see from looking at the seasonally unadjusted figures, the raw data, that’s nowhere near the case. The figure is still bouncing around the low end of the range for this time of year. The trend may be worth noting but the absolute level is still extremely low.
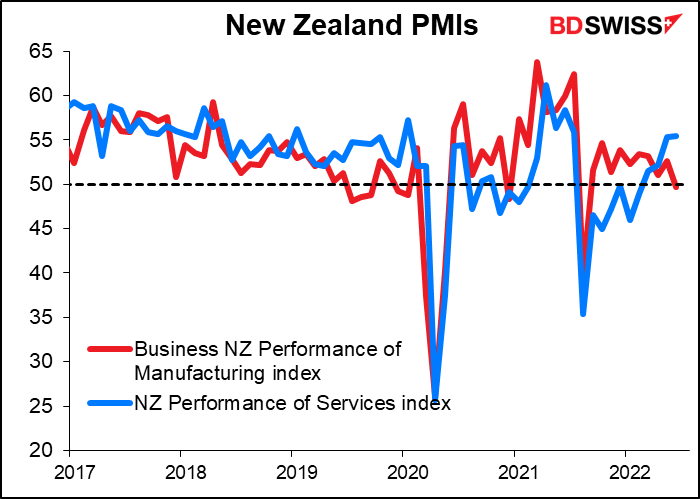
There are several New Zealand indicators out overnight but no forecasts for them so I’ll just present a graph of the purchasing managers’ index without any comment. The food index isn’t particularly market-moving but has a significant impact on the inflation rate so people watch it.
Then early Friday morning, it’s UK short-term indicator day, when we get blasted with a bunch of major indicators for that blessed plot, that earth, that realm, that UK.
Finally, Friday is “short-term indicator day” for the UK. They’ll announce the monthly and quarterly GDP, industrial and manufacturing production, and the trade balance. As usual, the focus will be on the GDP figure.
The Q2 GDP figure is expected to show a small decline from the previous quarter but still be up year-on-year. The figure is somewhat uncertain because of the unknown impact of the Jubilee weekend in June.
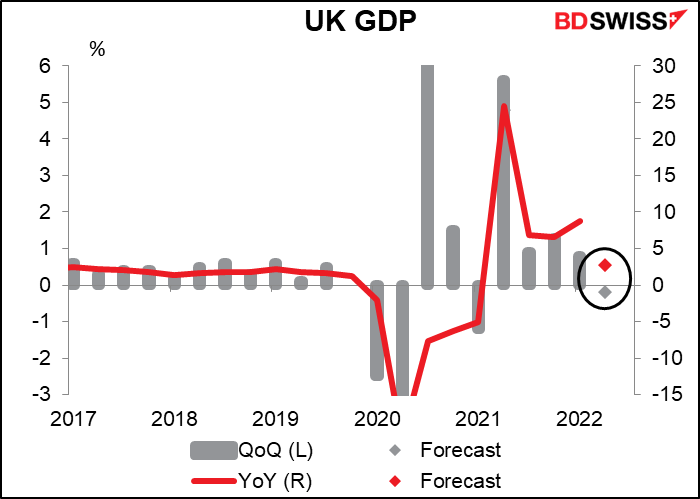
I think the more important figure though will be the monthly GDP figure for June. That will give a better feel for how badly the economy is imploding nowadays. It shows what kind of momentum the economy has going into Q3. According to Thursday’s Bank of England Monetary Policy Report, “GDP growth in the United Kingdom is slowing…The United Kingdom is now projected to enter recession from the fourth quarter of this year.” The monthly figure could give us a hint about whether the economy is on schedule to meet that target, although again some adjustments will have to be made for the Jubilee.

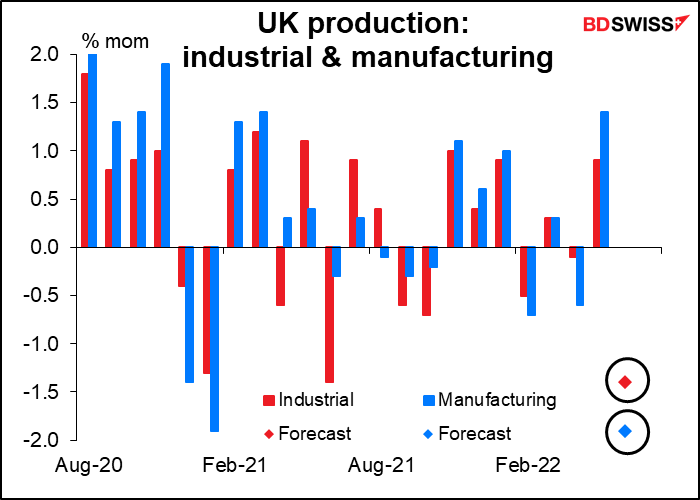
Industrial and manufacturing production are both expected to be lower, corroborating the downturn.
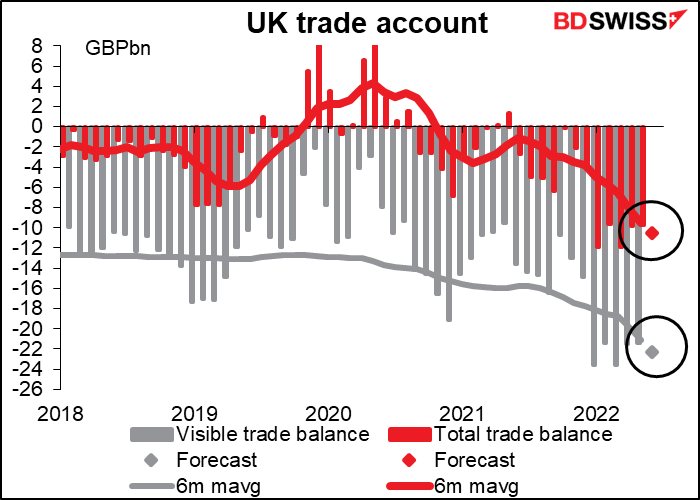
The trade deficit is expected to worsen, both visible and including services. We are waiting patiently for the benefits that being unshackled from the heavy hand of Brussels was supposed to bring to the UK’s trade position. The trade deficit has always been the Achilles heel of the British economy, as it necessitates higher interest rates to attract inward investment but those higher interest rates act as a drag on the economy. Or else maybe a lower currency would do the trick…
 Marshall Gittler
Posted on 25 April, 2024 at 15:14 GMT
Posted on 24 April, 2024 at 15:53 GMT
Posted on 23 April, 2024 at 11:46 GMT
Posted on 22 April, 2024 at 14:46 GMT
Posted on 19 April, 2024 at 13:15 GMT