BDSwiss App
Download & start trading

XAUUSD, EURUSD, BTCUSD, and USOIL are among the top 4 popular markets. Today marks the third day of the active trading week, providing an excellent opportunity to review recent market trends, current movements, and anticipate potential shifts before the week concludes in these markets.
XAUUSD
Sentimental Analysis
At 1:55 GMT, the BDSwiss mobile app displayed a sentiment of 67% bearish positions and 33% bullish positions for XAUUSD among traders.
Technical Analysis 
From a technical analysis standpoint using the 4-hour chart of XAUUSD, the price has been following a downtrend since April 19, 2024. A downtrend line drawn from $2415.32 rejected the price at $2329.37 after retracing from $2281.85, which currently acts as the support level, with the price currently hovering around $2317.02. If the rejection by the downtrend line persists, there is a strong likelihood of the price descending towards the current support level. Conversely, if the support level is breached to the downside, there is a high probability of further price decline. However, if the rejection by the downtrend line does not hold and the downtrend line is broken to the upside, there is a high chance of the price ascending further.
Fundamental Analysis
Gold prices decreased by 0.4% due to a stronger US dollar and reduced Treasury yields, which followed disappointing US jobs data. The absence of growth in US April Nonfarm Payrolls has intensified attention on potential adjustments to Federal Reserve interest rates in September. Investors are now eagerly awaiting comments from Federal Reserve officials and important data releases, including jobless claims and consumer sentiment indices, to gauge the market’s direction.
EURUSD
Sentimental Analysis 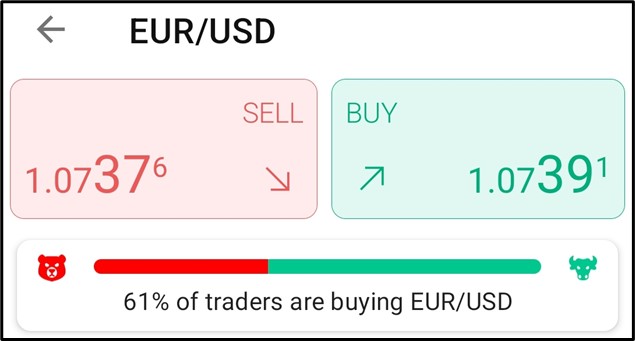
At 2:33 GMT, the BDSwiss mobile app displayed a sentiment of 61% bullish positions and 39% bearish positions for EURUSD among traders.
Technical Analysis 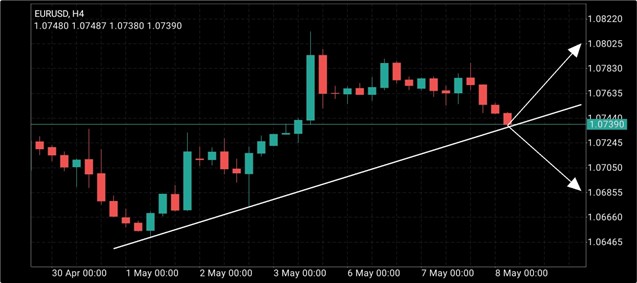
Using the 4-hour chart of EURUSD, it’s observed that the exchange rate has been in an uptrend since May 1, 2024. An uptrend line drawn from 1.06504 rejected the exchange rate at 1.06750 after a pullback from 1.07331. The uptrend continued to 1.08120 after the rejection, serving as the current resistance, before retracing to the current exchange rate at 1.07390, which is testing the uptrend line. If the uptrend line is breached to the downside, there are high chances of the exchange rate declining further, while breaking it to the upside could lead to further upward movement.
Fundamental Analysis
During Wednesday’s Asian session, EUR/USD continues to decline for the second consecutive session, hovering around 1.07390. This downward movement is attributed to the strengthening of the US Dollar, driven by expectations of the Federal Reserve maintaining higher interest rates.
BITCOIN ( BTC/USD )
Sentimental Analysis 
At 3:09 GMT, the BDSwiss mobile app displayed a sentiment of 74% bullish positions and 26% bearish positions for BTCUSD among traders.
Technical Analysis 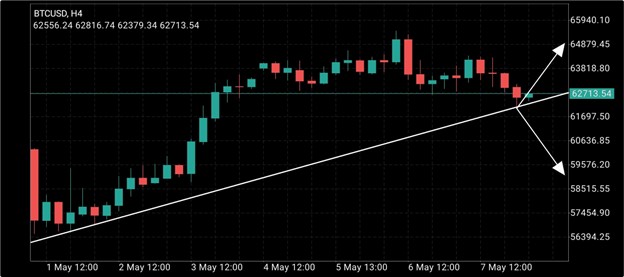
Based on technical analysis using the 4-hour chart of BTCUSD, it’s evident that the price has been on an upward trend since May 1, 2024. An uptrend line drawn from $56596.43 rejected the price at $62110.59 after a pullback from $65475.76, which currently acts as resistance, with the price currently around $62713.54. If the rejection by the uptrend line persists, there is a strong likelihood of further price appreciation. However, if the uptrend line is breached to the downside, there is a high probability of the price declining further.
Fundamental Analysis
On Monday, prices surged above $65,000 initially, but swiftly retreated as popular brokerage Robinhood (HOOD) revealed that its crypto division had received a Wells Notice from the U.S. Securities and Exchange Commission (SEC) over the weekend. This development, which typically precedes enforcement actions against companies, exerted additional downward pressure on prices.
USOIL

At 1:39 GMT, the BDSwiss mobile app displayed a sentiment of 83% bullish positions and 17% bearish positions for USOIL among traders.
Technical Analysis 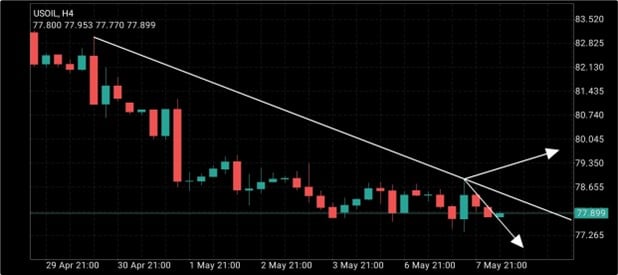
From a technical analysis standpoint using the 4-hour chart of USOIL, it’s evident that the price has been following a downtrend since April 30, 2024. A downtrend line drawn from $82.995 rejected the price at $78.884 after a pullback from $77.347, which currently acts as support, with the price currently around $77.899. If the rejection by the downtrend line persists, there is a strong likelihood of further downward movement in price. Conversely, if the downtrend line is breached to the upside, there is a high probability of the price increasing further.
Fundamental Analysis
On Tuesday, crude oil futures showed minimal movement as the United States took steps to replenish the strategic petroleum reserve, while the possibility of a cease-fire in Gaza remained uncertain. The U.S. Energy Department’s announcement of a bid to purchase 3.3 million barrels aimed at replenishing the reserve initially boosted oil prices during the session, but they eventually closed lower.
Sources :
BDSwiss Mobile App
Metatrader 4 ( MT4 )
 Da-Costa Assumang
Posted on 17 May, 2024 at 15:02 GMT
Posted on 16 May, 2024 at 13:08 GMT
Posted on 15 May, 2024 at 13:16 GMT
Posted on 14 May, 2024 at 11:41 GMT
Posted on 09 May, 2024 at 12:16 GMT